
How to Use TradingView for Derivative Trading: A Beginner’s Step-by-Step Guide
April 13, 2026
by Niels from Clicks and Trades Editorial Team
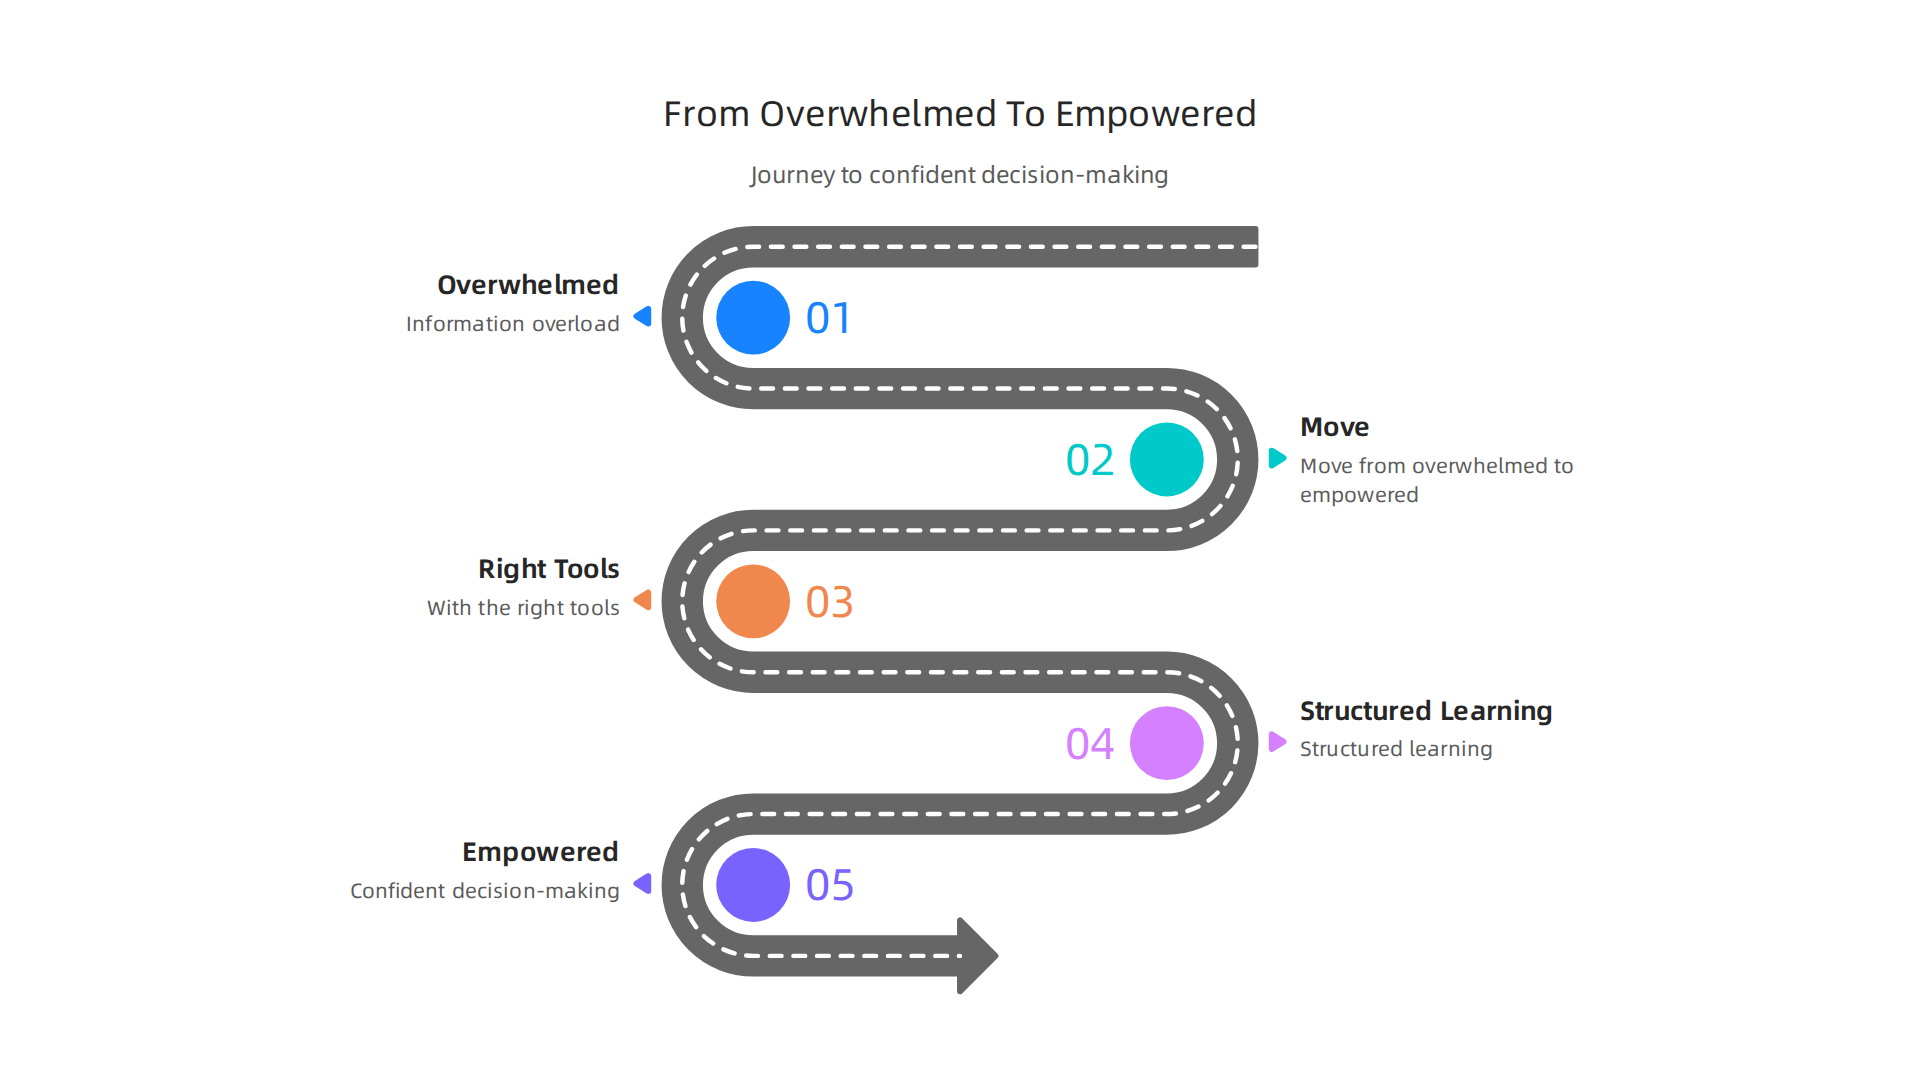
Introduction: From Overwhelmed to Empowered in Crypto Trading
It’s 2026. Cryptocurrency is everywhere, with nearly 40% of U.S. merchants now accepting digital assets. Yet, for a new trader, the excitement quickly fades into anxiety. You’re staring at a screen flashing endless numbers, tangled lines, and terms you don’t understand. You feel the pressure to make a move, but you’re frozen.

This isn’t just nerves; it’s a real psychological effect known as information overload, a major challenge for crypto investors that leads to decision fatigue and stress.
Sound familiar? You’re not alone. Many beginners jump into platforms that are built for experts, leaving them feeling lost. This is where the right tool makes all the difference.
Enter TradingView. Think of it less as a complex charting monster and more as your personal trading cockpit.

It’s the one platform that professional traders and beginners can both use. It gives you the power to perform deep technical analysis on anything from XAUUSD (gold) and AMZN to SPY stock and, of course, Bitcoin, all with a clean, understandable interface. The goal isn’t to show you every single button. The goal is to show you the right ones.
This guide is your shortcut. We’re cutting through the jargon to give you a practical, trustworthy setup. We’ll translate the overwhelming into the actionable. You’ll learn how to set up your first chart, spot basic trends, and understand what you’re looking at without the panic. Whether you’re curious about deriv tradingview strategies or just want to understand the SPX chart everyone’s talking about, we’ll build your confidence from the ground up.
To get started with a clear, step-by-step approach, many find it helpful to follow a structured tutorial, like this complete 2026 guide on using TradingView for crypto. And for ongoing support, consider joining a community that focuses on clarity. For simple, step-by-step crypto education and safety tips delivered to your inbox, you can sign up for the free Clicks and Trades newsletter. It’s a calm resource in a noisy space.
Let’s move from overwhelmed to empowered.
Why TradingView Stands Out for Derivative Trading Beginners
Imagine you’ve just opened a classic trading terminal. It’s a wall of green text on a black screen, flashing numbers and codes. Your eyes glaze over. For someone new to deriv tradingview strategies, this feels like trying to fly a jet before you’ve learned to drive.
Here’s the thing. You don’t need a cockpit designed for a pilot. You need a clear dashboard designed for a learner.
TradingView is that dashboard.
It stands out because it turns intimidating data into visual stories. Instead of deciphering lines of code, you see clean charts. You draw lines, add simple indicators, and understand price action at a glance. This visual, intuitive approach is why beginners don’t just use it. They actually understand it.
Trusted by New and Experienced Traders Alike
A tool is only as good as the trust behind it. TradingView isn’t a niche platform. It’s the industry standard. Professionals rely on its charts for deep technical analysis, while beginners use the same tools to learn the basics. This shared trust is powerful. When you learn on TradingView, you’re learning on the same platform that analysts use to track AMZN or debate the SPX trend.
This trust is backed by real growth. In 2026, retail trading interest has surged to record levels, with demand up significantly from prior peaks. Being on a platform that serves this massive, growing community means you have access to shared knowledge and reliable tools.
One Platform for Everything You Need
The biggest headache for a new trader is fragmentation. You might check one site for a SPY stock chart, another for crypto news, and a third for community ideas. It’s exhausting.
TradingView brings it all together. It’s a unified workspace. You can analyze XAUUSD (gold), plot a Bitcoin derivative strategy, and read market insights from other users, all without switching tabs. Its massive database covers millions of instruments from stocks and forex to global crypto assets. This unified approach cuts through the noise and lets you focus on learning.
For a deeper look at its capabilities, a recent TradingView review for 2026 highlights its powerful charting, over 100 indicators, and active community as key strengths for investors.
Think of it this way. Whether you’re starting with crypto derivatives or curious about traditional markets like forex, having a single, clear source of truth is invaluable. It simplifies the complex world of derivatives, making your first steps more confident and less cluttered.
Building confidence takes time and clear guidance. For straightforward, step-by-step lessons that help you navigate markets calmly, consider joining a community focused on learning. You can sign up for the free Clicks and Trades newsletter for simple crypto education and safety tips delivered directly to you.
Building Trust: The Importance of a Reliable Analysis Foundation
Imagine making a big decision based on a rumor from a stranger. That’s what trading can feel like when you rely on hype and loud opinions instead of clear data. For a new trader, unreliable tools or confusing social media noise are a direct path to stress and losses.
Studies on social trading show that the traders you follow "may not be as knowledgeable as you think," and blindly copying others can lead to "unexpected losses." This creates a dangerous cycle. You feel overwhelmed, make a quick choice based on someone else’s confidence, and often end up confused or losing money. In 2026, with information overload at an all-time high, this problem is more intense than ever.
TradingView cuts through that noise. It provides a transparent, data-driven foundation you can actually trust. Instead of wondering why someone is bullish on AMZN or bearish on SPX, you can open the chart and see the story for yourself. You learn to spot support levels on XAUUSD or identify a trend on SPY stock using the same technical analysis tools professionals use. This isn’t about following a crowd. It’s about building your own understanding.
Trust in your tools is the first step toward confident trading. When your charting platform gives you clean, reliable data, you stop second-guessing every move. You start making decisions based on what you see, not what you hear. This is especially critical in fast-moving markets like crypto or forex, where clear thinking is your greatest asset.
Building this confidence takes consistent, calm learning. If you want to move past the noise and receive straightforward guidance, a great next step is to get clear lessons delivered to you. You can sign up for the free Clicks and Trades newsletter for simple crypto education and practical safety tips.
Your First Steps: Setting Up TradingView for Derivative Market Analysis
You have a trusted tool. Now, let’s get it ready for action. The first time you open TradingView, it can feel like looking at the cockpit of a spaceship. But don’t worry. We are going to set up a clean, focused workspace step by step. This setup is your launchpad for smart deriv tradingview analysis.
Step 1: Create Your Free Account and Find the Chart
First, head to the TradingView website and sign up for a free account. It takes two minutes with your email. Once you’re in, you’ll land on the main page. Look for the "Chart" button, usually at the top of the screen, and click it. This opens the core charting interface, your new home for technical analysis.
This blank chart is your canvas. Here, you can analyze anything from SPX TradingView indices to XAUUSD TradingView pairs. But for derivatives, we need the right symbol.
Step 2: Find the Right Derivative Symbol
This is the most important step for accurate analysis. In the symbol search bar at the top, you don’t just type "Bitcoin." You need the specific futures or perpetual contract symbol.
For crypto perpetual futures, which are very popular derivatives that never expire, you’ll search for symbols like BTCUSDTPERP for Bitcoin or ETHUSDTPERP for Ethereum. As TradingView explains, a key feature of these perpetual contracts is that they don’t have a set expiry date, unlike traditional futures. Always ensure the symbol has "PERP" or "FUTURES" in its name to confirm you’re looking at the derivative market, not the spot price.
Step 3: Simplify Your Layout to Avoid Overwhelm
Now you have a chart. It might be crowded with indicators you don’t need yet. Our goal is clarity. Here’s how to make it beginner-friendly:
- Clear the Clutter: On the top toolbar, find the "Indicators" button. Click it and review the list at the bottom of the chart under "Indicators." Remove any complex ones by clicking the ‘x’ next to them. Start fresh.
- Set a Clean View: Choose a simple candlestick chart style. You can adjust the color scheme in the chart settings (the gear icon) to something easy on your eyes, like a dark background with green and red candles.
- Save Your Layout: Once your chart looks clean, save this setup as your default. Click the "Layout" menu at the very top and select "Save Layout As." Name it something like "My Clean Start." This saves all your settings. According to TradingView’s own guide on layouts, saving your customized setup is the best way to stay organized and jump straight into analysis every time you log in.
And that’s it. You now have a focused TradingView chart set up for analyzing derivative markets. You’re not just looking at a price anymore. You’re looking at the specific contract you want to trade, with a clean screen that helps you think.
Remember, this is about building your skill, not memorizing complexity. If you want to continue learning with simple, step-by-step guides that help you understand charts without the stress, consider getting clear lessons delivered to you. You can sign up for the free Clicks and Trades newsletter for straightforward crypto education and practical tips to keep you grounded. It’s a great next step in your journey.
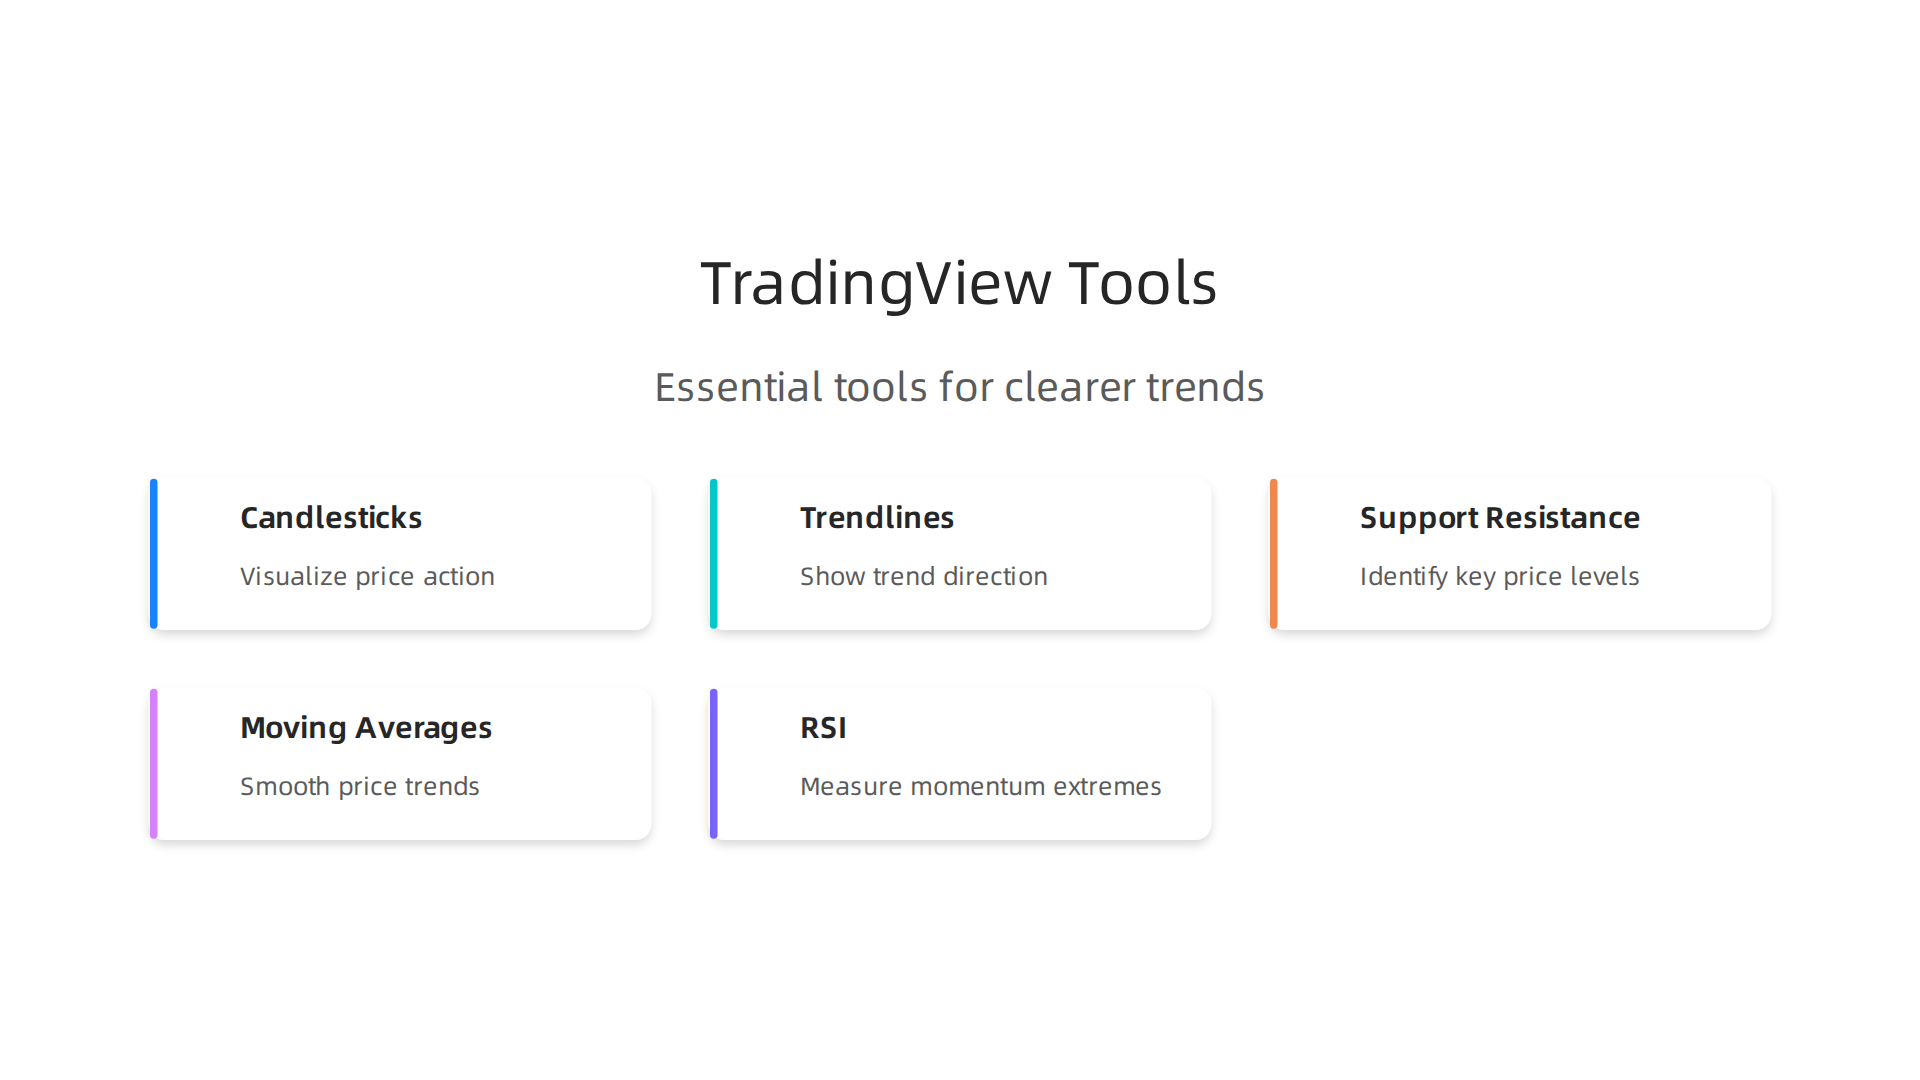
Decoding the Charts: Essential TradingView Tools for Clearer Trends
Your chart is clean. The right derivative symbol is loaded. Now what? Staring at a screen of green and red candles can still be confusing. The goal isn’t to predict the future with magic. It’s to understand what’s happening right now. Let’s break down the essential tools on TradingView that turn a confusing chart into a readable story.
Start by Reading the Basics: Candlesticks and Timeframes
Every chart is built from candlesticks. One candle shows the opening price, closing price, and the high and low for a specific period. A green candle means the price closed higher than it opened during that time. A red candle means it closed lower. That’s the foundation of all technical analysis.
Above your chart, you’ll see timeframes like "1D" for one day or "1H" for one hour. This is crucial. A "1D" candle shows you the full daily battle between buyers and sellers for an asset like XAUUSD Tradingview. A "15M" (15-minute) candle shows you much shorter, noisier moves. Start with the 1-day or 4-hour chart to see the bigger picture before zooming in.
Your First Drawing Tools: Trendlines and Key Levels
Before adding any fancy indicators, learn to draw. The drawing tools toolbar is on the left side of your chart.
- Trendlines: Click the trendline tool and draw a straight line connecting two or more important low points in an uptrend, or high points in a downtrend. This simple line can show you the market’s current direction. Is the price staying above your line? The trend might still be up.
- Support and Resistance: These are horizontal lines that mark where the price has repeatedly stopped falling (support) or stopped rising (resistance). Draw them across clear price levels where the chart has bounced. These zones are where the market often pauses or reverses, giving you context for where to pay attention next. This skill is useful whether you’re looking at SPX Tradingview indices or crypto futures.
Add Context, Not Noise: Two Beginner-Friendly Indicators
Indicators are math formulas plotted on your chart. They don’t tell you what will happen. They help clarify what is happening. For beginners in deriv tradingview, two are more than enough.
-
Moving Averages (MA): The Trend Helper. A Moving Average smooths out price data to show you the average price over a set period. The Simple Moving Average (SMA) is one of the most basic and helpful indicators for discovering trends, as noted by Binance. Add a 50-period and a 200-period SMA to your chart. When the price is above these lines, and the faster (50) MA is above the slower (200) MA, it generally suggests an uptrend. It’s a simple visual filter for the market’s direction.
-
Relative Strength Index (RSI): The Speed Gauge. The RSI measures how fast and how much the price has moved. It oscillates between 0 and 100. A common rule is that a reading above 70 suggests the market might be "overbought" or moving up too fast, while a reading below 30 suggests it might be "oversold" or moving down too fast. As a guide for beginners from Altrady points out, the RSI is often the best starting point because it’s simple to see when momentum is getting extreme. Remember, it’s a gauge, not a trigger.
The Golden Rule: Look for Confirmation
This is the secret that reduces impulsive, emotional decisions. Never rely on one tool alone.
Is the RSI showing an overbought reading above 70? That’s one clue. But is the price also hitting a strong historical resistance line you drew? That’s a second clue. And is it doing this while the price is still above your key moving averages? Now you have context.
Confirmation means waiting for two or three of your tools to tell a similar story. It filters out the false signals and the market noise that causes most beginners to jump in or out at the wrong time.

This disciplined approach is what separates hopeful guessing from structured analysis, whether you’re trading SPY stock Tradingview or crypto derivatives.
Mastering these core tools gives you a massive advantage. You’re learning to read the market’s language. For more step-by-step lessons that help you build this skill without the overwhelm, consider joining a community focused on clear education. You can sign up for the free Clicks and Trades newsletter to get practical tips and straightforward guidance delivered to you. It’s a great way to continue learning in a calm, focused way.
Beyond the Hype: Using TradingView’s Community Features Wisely
You’ve learned to read the charts. Now, you open TradingView and see a flood of ideas, alerts, and predictions from other people. It’s exciting. It can also be overwhelming and risky if you don’t know how to navigate it.
Think of TradingView’s community like a huge library. It’s full of information, but not every book is worth reading. Your goal isn’t to find someone to blindly follow. It’s to learn from how experienced analysts think.
How to Find and Learn from Good Analysts
Don’t just look for someone who made a lucky call. Look for a clear methodology.
- Check the Chart, Not Just the Prediction. When you see an idea on a stock like AMZN Tradingview or a deriv tradingview chart, open the analyst’s published chart. Do they draw clear support and resistance lines? Do they explain why they think a level is important? A good analyst teaches you their process.
- Review Their History. TradingView shows an analyst’s past ideas. Look for consistency in their approach, not just a few big wins. Do they admit when they were wrong? Transparency is a sign of credibility.
- Focus on Education, Not Signals. The best users don’t just say “Buy here.” They explain the market context. They might discuss how a Federal Reserve news event, visible on TradingView’s own economic calendar, is impacting the SPX Tradingview index. This helps you learn to connect news to price action.
The Big Warning: Never Copy Blindly
This is the most critical rule. Social trading features can be helpful, but they come with serious risks. Experts consistently warn that blindly copying trades without understanding them can lead to unexpected losses. The person you’re following may not be as knowledgeable as they seem, and herd mentality can cloud your own judgment.
Treat every published strategy or alert as a learning case study. Ask yourself: “Does this align with the technical analysis rules I’m learning?” If an alert goes off for XAUUSD Tradingview, check if the price is actually at your drawn support level or if the RSI is oversold. Use their idea as a starting point for your own analysis.
Use Built-In News to Understand the “Why”
Charts show what is happening. News helps explain why. TradingView integrates news and an economic calendar directly into the platform.
Instead of scrolling through scary headlines on social media, use this tool simply:
- Look for Major Events: The economic calendar highlights big events like interest rate decisions or employment reports. See if a sharp move on your SPY stock Tradingview chart coincides with one of these events.
- Filter the Noise: You can set alerts for news only on the symbols you watch. This prevents information overload and helps you focus on what matters to your portfolio.
Using the community wisely turns TradingView from just a charting platform into a powerful learning hub. You get to see how different traders approach the same Tradingview API data. The key is to stay curious, critical, and always do your own homework.
For more straightforward guidance on navigating the markets safely, consider joining a community focused on clear education. You can sign up for the free Clicks and Trades newsletter to get practical tips that help you build confidence in your own analysis.
Creating a Sustainable Routine: Alerts, Journals, and Risk Management
Great analysis is useless without great habits. You can master the charts, but if you’re glued to the screen all day or forgetting why you made a trade, you’ll struggle. The real secret to using a platform like TradingView isn’t just about finding the perfect deriv tradingview setup. It’s about building a calm, disciplined routine that protects your time and your capital.
Let’s break down the three pillars of a sustainable trading routine.
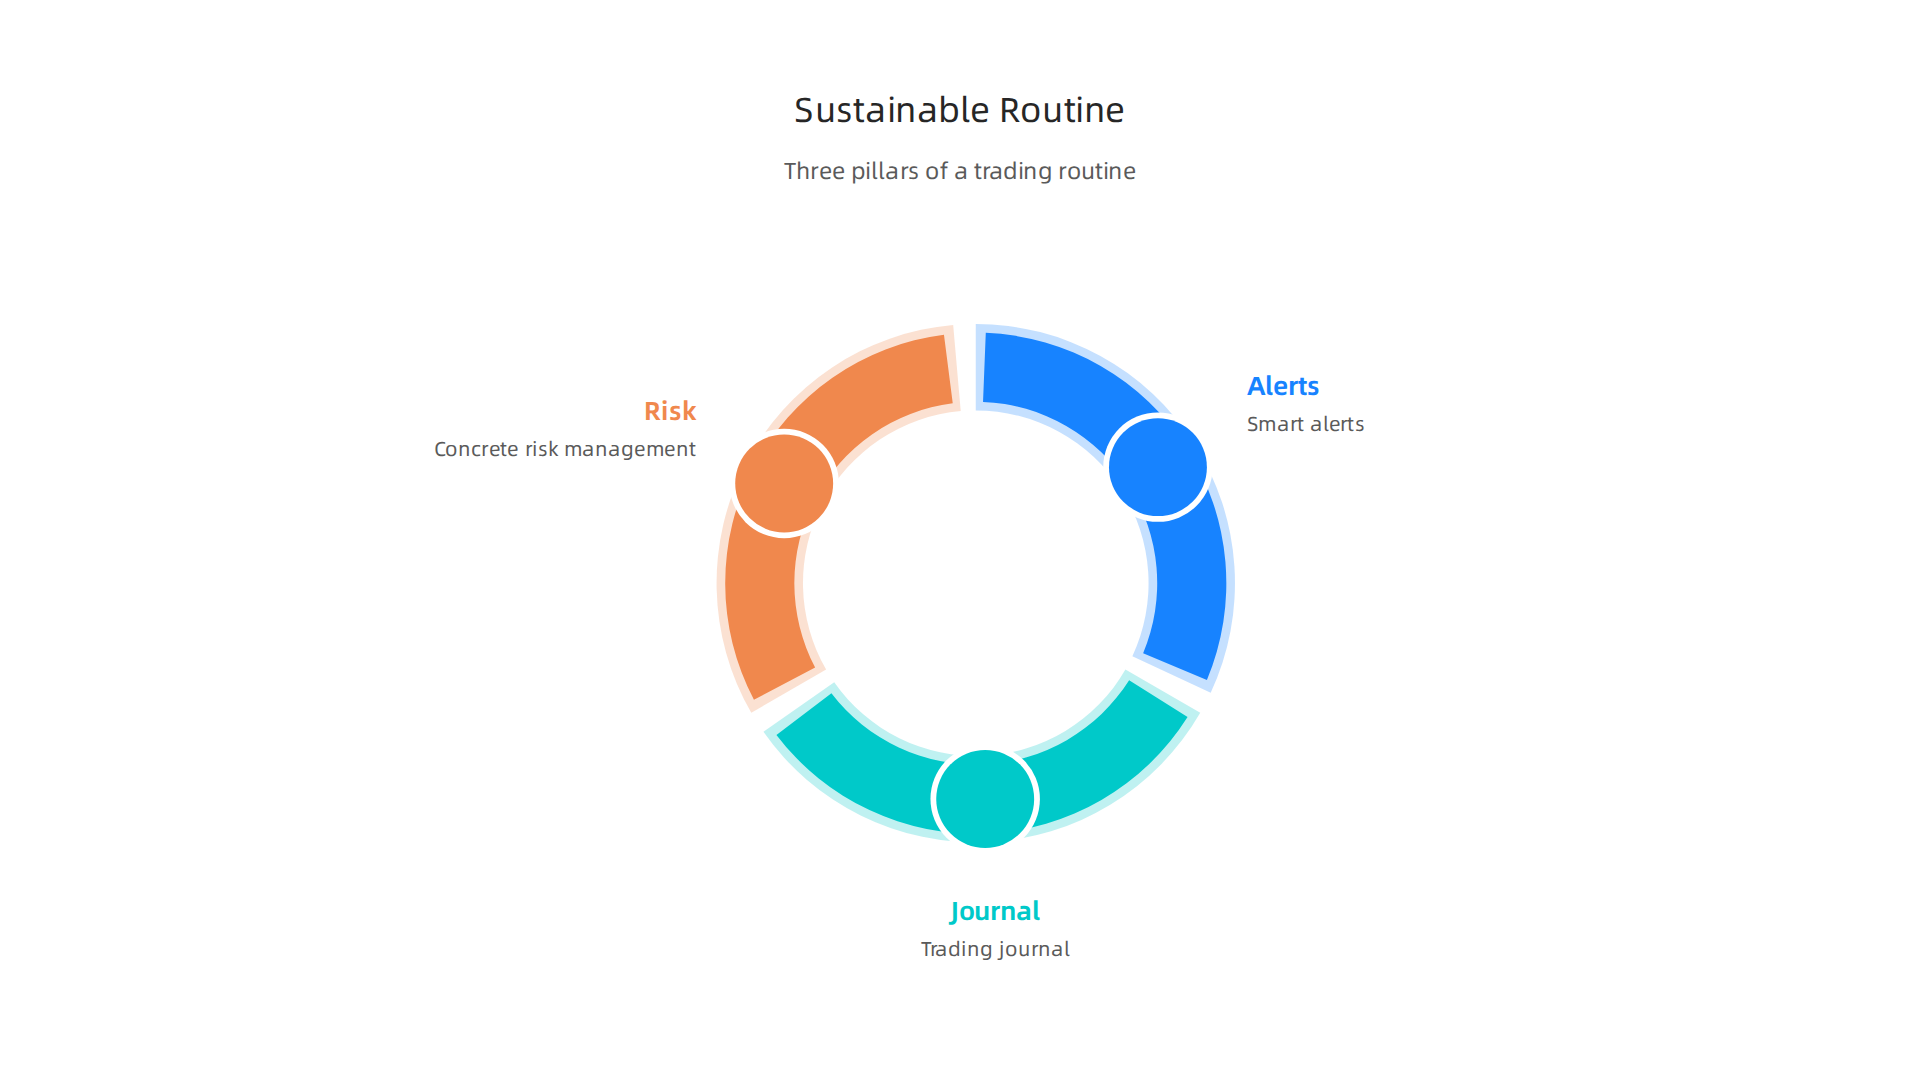
1. Set Smart Alerts, Break the Screen Addiction
Constantly watching candles flicker is exhausting and leads to impulsive decisions. TradingView’s alert system is your freedom tool.
Instead of staring, set simple, rules-based alerts. For example:
- Price Alerts: Get a notification when AMZN tradingview stock hits a key support level you’ve drawn.
- Indicator Alerts: Set an alert for when the RSI on your XAUUSD tradingview chart moves above 70 (overbought) or below 30 (oversold).
- Pattern Alerts: Use the TradingView API or built-in tools to alert you when a specific chart pattern, like a triangle breakout on the SPX tradingview index, is detected.
This way, the platform works for you. You can step away, focus on other things, and only engage when your predefined conditions are met. This removes emotion and saves your mental energy for analysis, not surveillance.
2. The Non-Negotiable Habit: Keep a Trading Journal
Your memory is your worst trading enemy. You’ll remember your big wins and forget your repeated small mistakes. A trading journal fixes that.
Think of it as your personal strategy lab. Every time you make a trade, log:
- The chart setup (take a screenshot from TradingView).
- Your entry and exit reasoning. Was it a breakout? A bounce off support?
- The outcome.
- Your emotional state. Were you feeling greedy, fearful, or confident?
This isn’t busywork. Research from 2026 involving 10,000 traders shows that those who keep a detailed journal see measurable improvements in their returns. Why? Because a journal transforms vague feelings into clear data. You start to see which technical analysis setups work for you and which ones consistently fail. Experts agree that a trading journal increases discipline and allows for objective performance tracking.
You can start simple with a notes app or spreadsheet. Some traders even use TradingView’s Pine Script to create custom logging tools. The key is consistency.
3. Connect Your Analysis to Concrete Risk Management
This is where your chart work pays off. Every line you draw should have a purpose for managing risk.
Before you enter any trade on a SPY stock Tradingview chart or anywhere else, use your chart levels to decide two things:
- Your Stop-Loss: Where is the trade idea invalidated? Place your stop-loss just beyond a key support or resistance level. This defines your maximum risk upfront.
- Your Take-Profit: Where is the next logical area of resistance or your target? This defines your potential reward.
This 1:2:1 ratio of analysis to action is crucial. It turns subjective chart views into a disciplined plan. This disciplined approach to planning is a core skill, whether you’re analyzing forex pairs or other assets. You can learn more about applying these principles in different markets by reading our guide on why forex trading can feel simpler than crypto.
By combining smart alerts, a faithful journal, and risk-defined trades, you build a system. This system runs on discipline, not emotion. It helps you learn faster, stress less, and make decisions you can stick with over the long term.
Building these habits takes guidance. For straightforward, step-by-step help developing a calm and confident trading routine, consider joining a community focused on clear education. You can sign up for the free Clicks and Trades newsletter to get practical tips delivered directly to you.
Common Beginner Pitfalls on TradingView and How to Avoid Them
Now that you have a routine, let’s talk about what can break it. TradingView is an incredible tool, but it’s easy to get tripped up. Many beginners fall into the same traps, turning their charts from a helpful guide into a source of stress and loss.
Here are the three most common mistakes people make and how you can steer clear of them.
1. Indicator Overload: When More Means Less
This is the biggest trap. You open the indicator menu and it’s like a candy store. You add a Moving Average, then the RSI, then the MACD, then a Bollinger Band, and suddenly your chart for AMZN tradingview or XAUUSD tradingview is a blinking, contradictory mess.
Here’s the thing. More indicators don’t mean better analysis. They usually mean confusion. When every indicator gives a different signal, you end up paralyzed, unable to make a decision.
How to avoid it:
Start with one or two. Experts consistently recommend that beginners master simple tools first. For example, the Relative Strength Index (RSI) is often considered the best starting point for new traders. A Simple Moving Average is another foundational tool for spotting trends. Pick one or two, learn what they really mean, and see how price reacts to them. Clean charts lead to clear thinking.
2. Chasing "Perfect" Setups from Social Media
You see a post showing a flawless trade on SPX tradingview or a crypto chart. It looks easy. So you start hunting for that same perfect pattern on every chart, entering trade after trade that doesn’t work out. This is overtrading, and it drains your account fast.
Social media often shows the wins and hides the hundred losses that came before. Chasing these ghosts will have you forcing trades where none exist.
How to avoid it:
Trust your own plan, not someone else’s highlight reel. This is where your trading journal becomes your best defense. By logging your own trades, you build confidence in your own strategy. Research shows that maintaining a detailed journal helps increase discipline and allows for objective performance tracking. Focus on the process you built in the last section, not the fantasy you see online. This disciplined, self-trusted approach is a key reason some find that forex trading can feel simpler than crypto.
3. Misunderstanding Leverage and Hidden Costs
This is especially critical for deriv tradingview users. When you look at a chart for a derivative product (like a futures contract), the price movement might look small. But these products use leverage, which acts like a magnifying glass on both your profits and your losses. A tiny move on the SPY stock Tradingview chart can mean a big win or a devastating loss.
Beginners often see the potential for big gains and ignore the math of risk. They also forget about costs like funding rates, which are periodic fees that can slowly eat away at your position, even if the price isn’t moving.
How to avoid it:
Never use leverage until you fully understand the math. Always calculate your position size based on where your stop-loss is, not on how much money you want to make. Treat leverage with extreme respect. It’s a powerful tool that requires even more powerful risk management, exactly like we discussed in your routine.
Learning to navigate these pitfalls is a huge step toward becoming a consistent trader. For more straightforward guidance that helps you avoid hype and build solid habits, sign up for the free Clicks and Trades newsletter. You’ll get clear, step-by-step tips to help you trade with more confidence and less confusion.
Your Path Forward: From Beginner to Informed User
You have your routine. You know the common traps to avoid. So, what comes next? The goal is to move from simply using the platform to understanding it deeply. Here is a logical path to grow your skills in 2026.
Phase 1: Cement the Core
Do not rush. Your first job is to become fluent in the basics you’ve already started. This means getting so comfortable with one or two indicators on your AMZN tradingview or XAUUSD tradingview chart that you can explain why price moved. Practice drawing support and resistance lines until it feels natural. The foundational skill of technical analysis is reading the story price tells, not just looking at pretty lines. A recent independent TradingView review for 2026 confirms that mastering its core charting tools is the most powerful step for new users.
Phase 2: Explore the Platform’s Depth
Once the basics are second nature, you can safely explore. This is when you might test the strategy tester on a SPY stock Tradingview chart to see how an idea would have worked in the past. You could watch a tutorial on using the Fundamental Graphs tool to add another layer to your analysis. If coding interests you, the Tradingview api and Pine Script are there. But remember, Phase 1 comes first. You wouldn’t build a race car before learning to drive.
Phase 3: Adopt the Right Mindset
The final, most important phase is internalizing the trader’s mindset. The goal is not to predict the future. It is to think in probabilities and manage risk consistently. Every trade is a calculated bet, not a sure thing. This is especially true for leveraged products like those analyzed on deriv tradingview. By focusing on a solid process, you build the discipline needed for the long term, whether you’re looking at SPX tradingview or crypto charts.
Trusted Resources for Your Journey
The good news? You are not alone. There is more quality, free education available now than ever before. With retail trading demand hitting record levels in early 2026, many educators focus on clarity for beginners.
For ongoing, step-by-step guidance that cuts through the noise, I recommend the free Clicks and Trades newsletter. It delivers clear tips directly to your inbox, helping you build confidence one lesson at a time. It’s a perfect companion as you move from beginner to informed user.
Your path forward is about steady growth. Master a simple tool. Test it. Learn a little more. With patience and the right resources, the complex world of charts starts to make perfect sense.
Ready for the next clear lesson? Sign up for straightforward insights to guide your learning.
Summary
This guide turns TradingView from an intimidating charting platform into a practical workspace for derivative traders. It explains why TradingView is a trusted, unified tool for analyzing futures and perpetual contracts, then walks you through the first setup steps: creating a free account, searching for the proper PERP/FUTURES symbols (e.g., BTCUSDTPERP), and simplifying your layout. You’ll learn how to read candlesticks and timeframes, draw trendlines and key support/resistance levels, and use two beginner-friendly indicators (50/200 SMAs and RSI) with a confirmation-first approach. The article also covers how to use TradingView’s community and news features wisely, build a sustainable routine with alerts and a trading journal, and avoid common pitfalls like indicator overload, blind copying, and misusing leverage. By the end, you’ll have a clear, repeatable process for calm, data-driven derivative trading and the next steps to grow your skills.